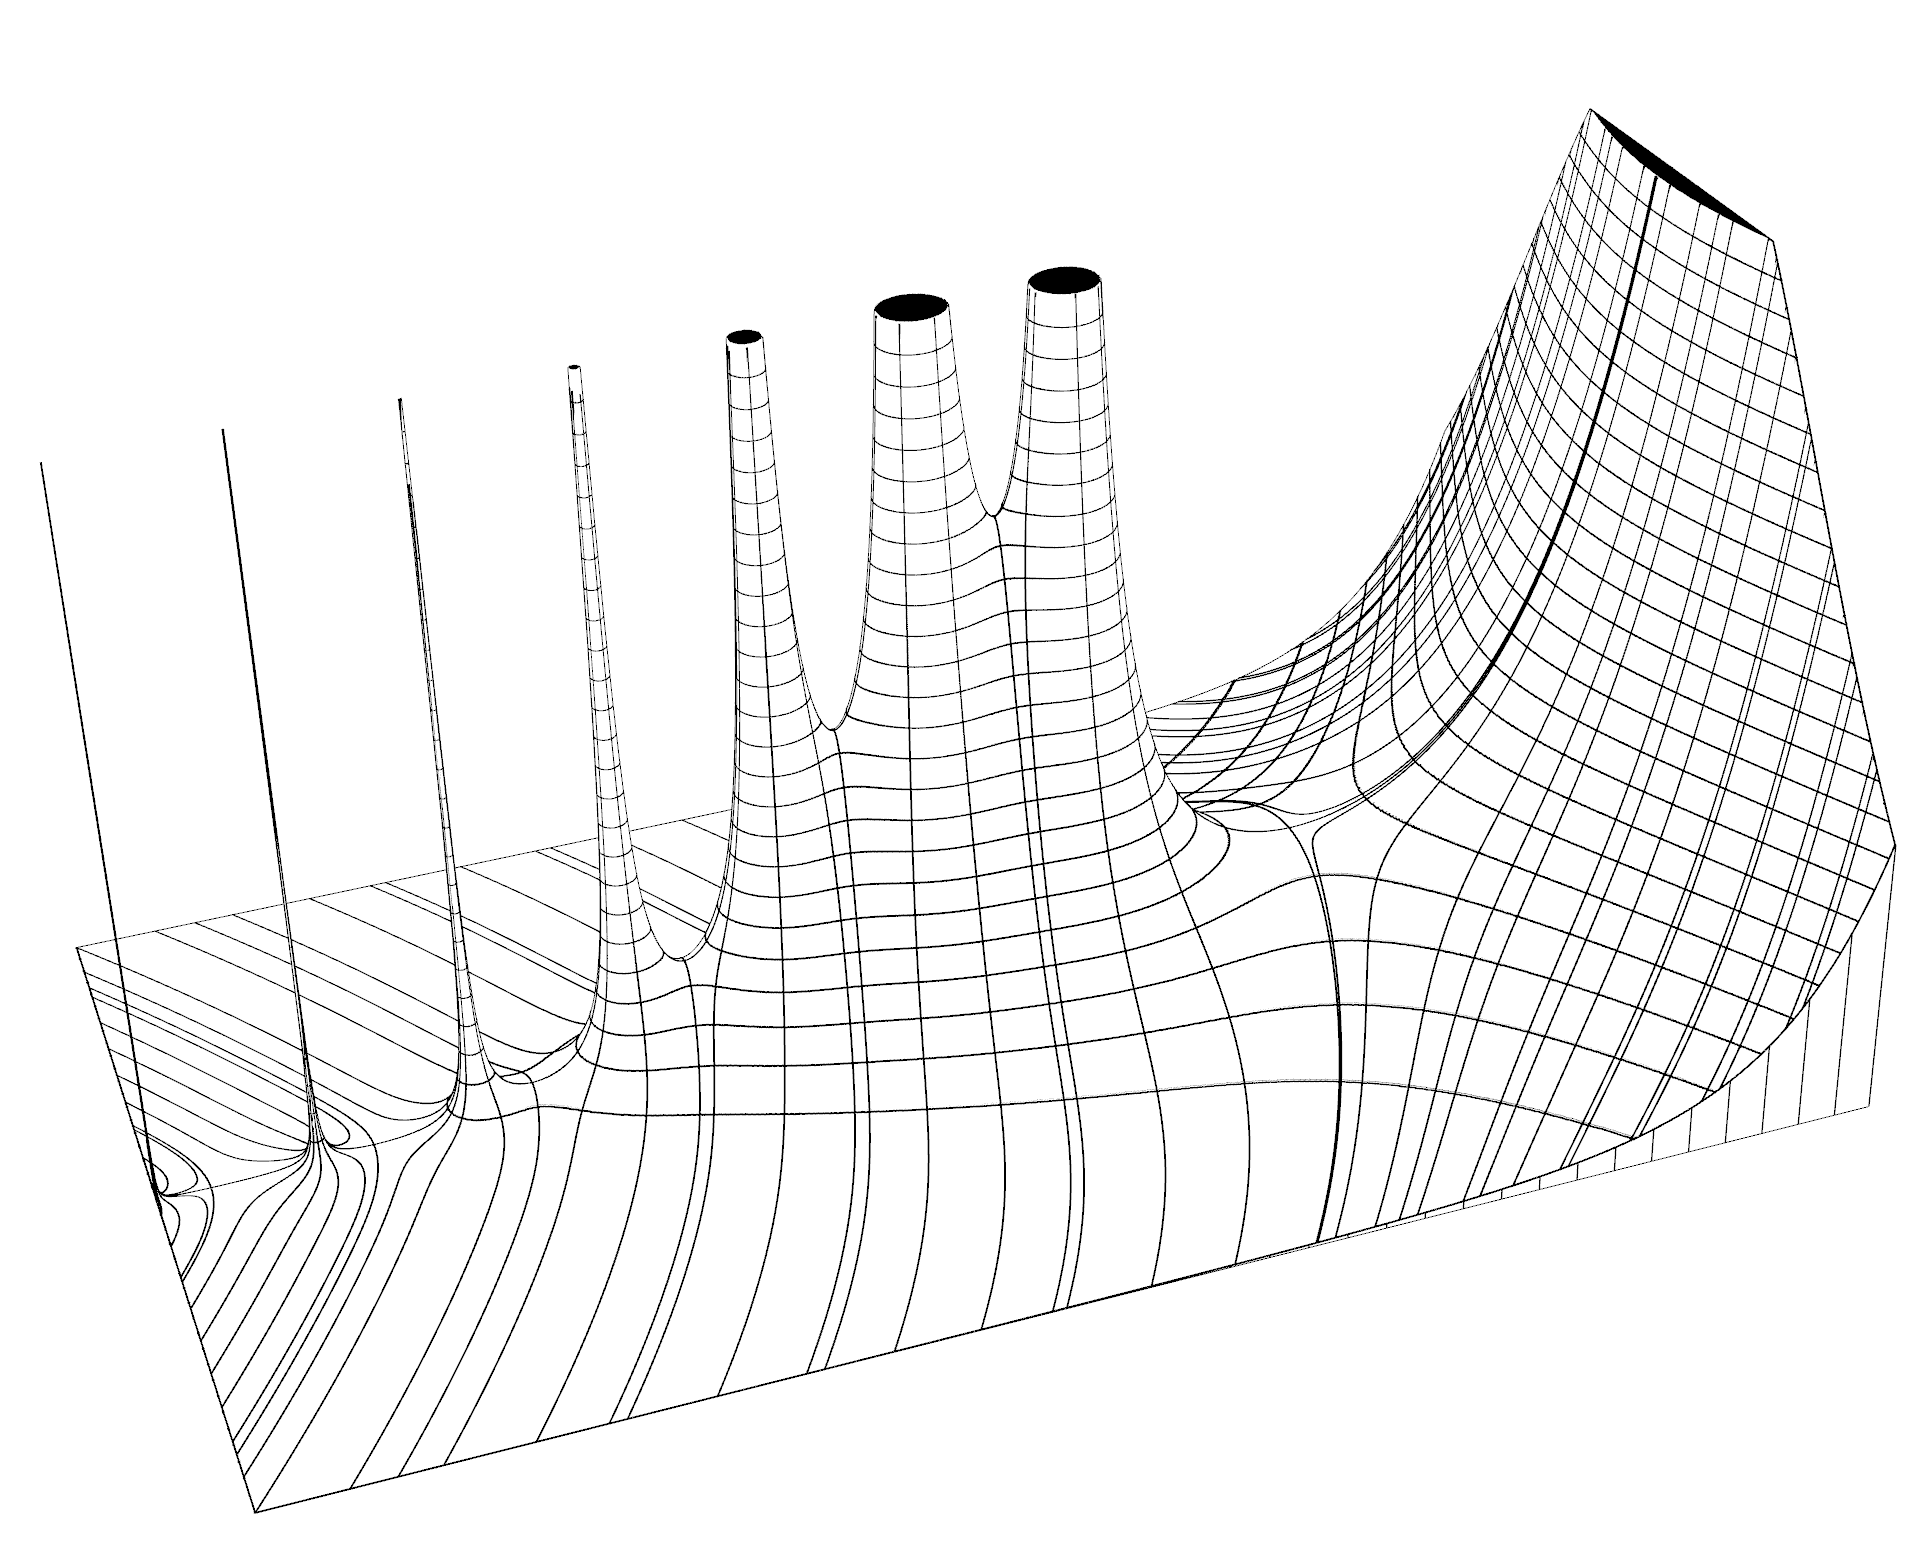
A famous volume by E. Jahnke and F. Emde featured a collection of plots of bivariate functions of unparalleled quality and detail, all drawn by hand. The graphs plotted by computer software do not come even close to these century-old graphs. The goal of this project is to try to fill the gap between mesh-based graphs and these hand-drawn graphs including details such as level curves, gradient ascent and descent lines, saddle points and more.
Report
We have successfully developed and implemented the three basic components of the Jahnke—Emde style plotting:
- Constructing the smooth level curves with a variation of the marching squares algorithm, components separation and interpolation.
- Efficient search of critical points with Hessian-based gradient descent, their clustering and classification by type.
- Building the gradient lines in computationally- and data-efficient manner.
Each of these steps presented a challenge in optimization, and striking a balance between computational efficiency and precision required a careful analysis and testing.
All of components have been combined in a working prototype using Plotly engine, and deliver a very decent result, accompanied with some extra decorations (pole caps, domain boundary scrirt, etc.).
The results are available on GitHub repository.